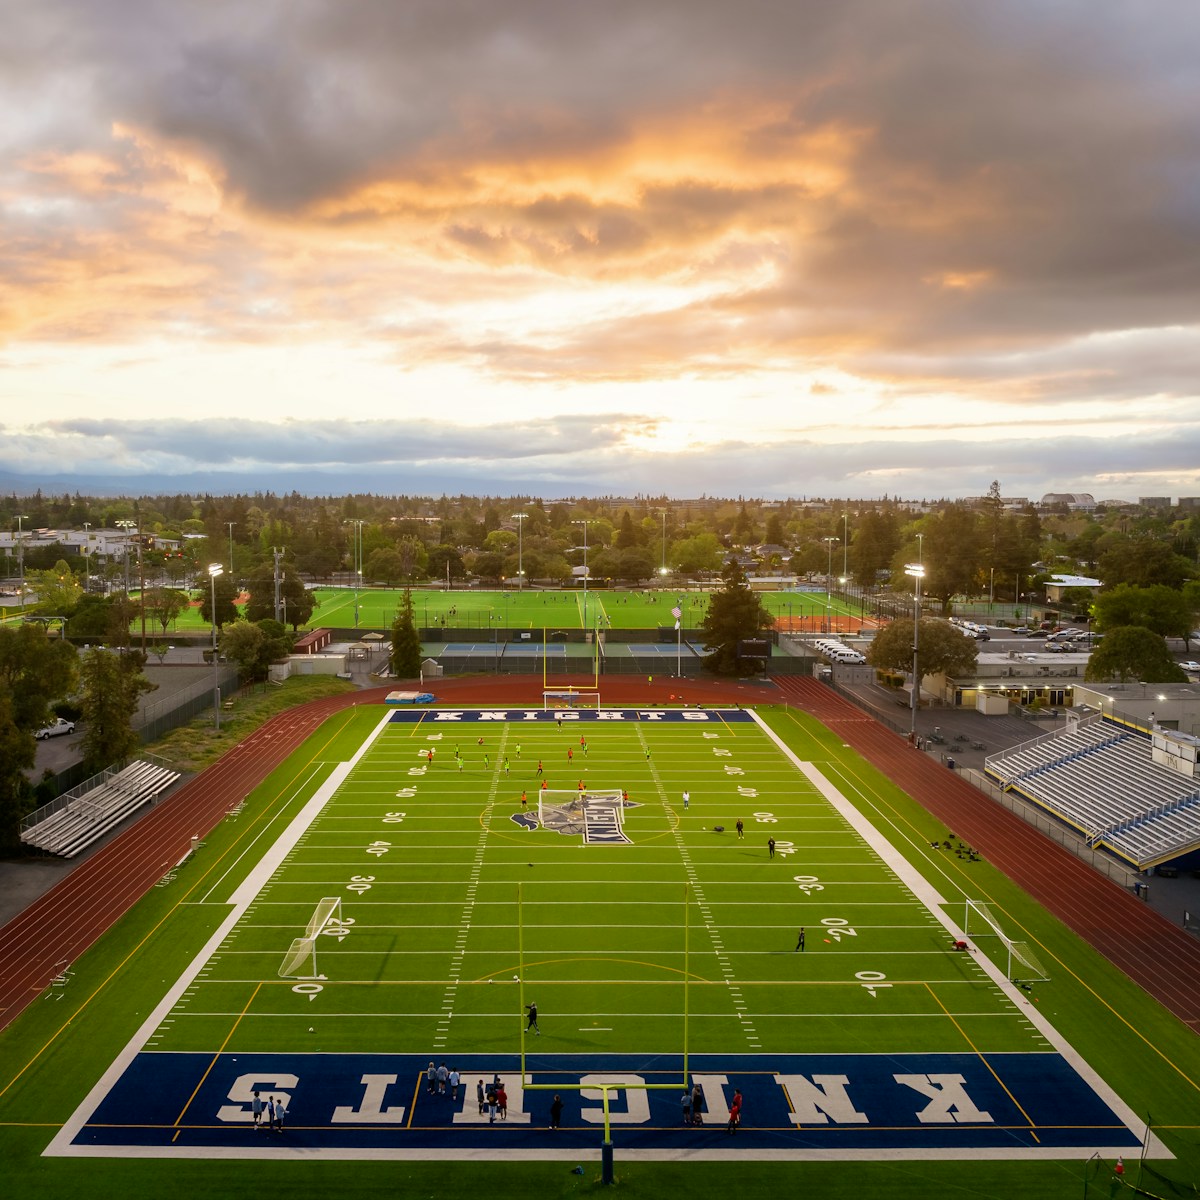

The Big Ten enters 2026 with the same structural question it has faced since the Pac-12 remnants joined: can a 16-team conference produce a coherent race, or does the geography and schedule variance turn it into two separate leagues sharing a name? The analytical answer is closer to the second version than the first, and it changes how you should read every Big Ten preview that arrives this month. Schedule math decides roughly half of the outcome. Talent decides the other half. This is how to read both.
Quick read: Big Ten 2026 in 60 seconds
- Top contenders: The traditional Ohio State-Michigan axis remains, joined by a healthy Penn State and one or two Pac-12-transplant teams with legitimate top-15 SP+ profiles.
- Schedule variance: Cross-divisional matchups produce a wider SOS spread than any conference in college football; two teams with identical talent can face schedules worth 3-4 SP+ points of difference.
- Returning production: Wide across the conference; the Big Ten’s portal usage runs somewhat lower than the SEC, which means RP calculations behave more predictably.
- Coaching continuity: Mostly stable at head-coach level; several key coordinator changes at contending programs create the year’s noisier projections.
- CFP implications: Big Ten will produce 2-3 CFP teams under the twelve-team format; the third bid is the annual bubble conversation.
Why the schedule math matters so much here
The Big Ten’s schedule structure has become the single largest source of noise in its conference preview coverage. With 16 teams and only nine conference games, teams face different opponents in different rotations, and two teams entering the season with identical SP+ projections can end the year separated by two conference losses purely because one drew Oregon, Ohio State, and Penn State while the other drew Northwestern, Purdue, and Maryland. This isn’t hypothetical; it’s the structural reality that every serious 2026 Big Ten projection has to adjust for.
The practical implication for reading previews: any Big Ten piece that doesn’t cite strength-of-schedule variance is missing roughly half the story. SP+ handles the adjustment reasonably well because it explicitly models opponent quality; simpler win-projection models don’t, which is why they systematically over- and under-project specific programs based on schedule luck. Our SP+ and returning production piece covers the vocabulary; the Big Ten is where that vocabulary earns its keep.
Big Ten contender tier rankings
| Tier | SP+ projection | CFP implication |
|---|---|---|
| National contender tier | Top 10 SP+ | CFP bid likely if schedule cooperates |
| Strong conference tier | 11-25 SP+ | CFP bubble; schedule variance dominates the resolution |
| Bowl tier | 26-50 SP+ | Bowl-eligible likely; conference-championship path effectively closed |
| Rebuild tier | 50+ SP+ | Multi-year projects; the schedule variance matters less because the ceiling is lower |
| Coaching transition tier | Variable SP+ | Year 1 unpredictable regardless of talent |
| Portal-driven tier | RP misleading | Manual adjustment required; the standard calculation misfires |
| Recovery tier | Bounce-back candidates | Injury-decimated 2025 seasons often over-recover |
A reading framework for Big Ten previews
| Question | What it reveals |
|---|---|
| What is the SP+ projection? | Quality baseline — the single strongest preseason number |
| What does the schedule look like relative to conference average? | The variable that Big Ten previews most often miss |
| What is the returning production? | Continuity from prior season, portal-adjusted |
| Has the coordinator staff changed? | Scheme stability |
| How does the QB situation look? | Most important position; multiplier on every other signal |
| What is the recruiting class rank? | Two-year signal, not Year 1 |
| What does the cross-conference schedule include? | Non-conference opponents shape CFP tiebreaker resumes |
The vocabulary lives in our field guide. The deeper returning-production discipline is in our returning production piece. For historical projection accuracy, Bill Connelly’s SP+ archive is the primary reference.
The three storylines that actually matter
Every Big Ten preview cycle produces a lot of manufactured storylines about coaching hot seats and offseason chatter, most of which don’t survive contact with October. The three real storylines for 2026 are: the Ohio State-Michigan-Penn State top tier (which will produce at least two CFP teams and likely resolve the conference championship), the Pac-12 transplant integration question (whether Oregon, USC, and Washington translate their 2025 SP+ profiles into a full second season of Big Ten-schedule adjustment), and the coaching-transition programs (which will underperform preseason projections by the usual 5-8 SP+ points).
Frequently asked questions
How does Big Ten schedule variance actually work?
With 16 teams and 9 conference games, teams face a rotating subset of the conference each year. Some rotations produce cupcake schedules (three of the four weakest teams); others produce brutal ones (Ohio State, Michigan, Penn State, Oregon in the same year). The SP+-based SOS metric captures this well; simpler win projections don’t.
How predictive is Big Ten preseason SP+?
Strongly. SP+ has historically explained a large share of Big Ten outcome variance from the preseason projection stage, especially when combined with returning production and coaching continuity adjustments.
How many CFP bids will the Big Ten get in 2026?
Likely 2-3 under the twelve-team format. The floor is two (the conference champion plus one at-large); the ceiling is three in a year where the top of the conference dominates and a third team survives with a favorable schedule.
Where can I track Big Ten analytics?
Bill Connelly’s ESPN columns for SP+ and returning production; Sports Reference for historical and current game data; local beat writers for team-specific context that projections don’t capture.
The takeaway, in one paragraph
The Big Ten in 2026 is really two conferences sharing a name: the top tier (Ohio State, Michigan, Penn State, Oregon) racing for CFP seeding, and the middle-and-bottom tier where schedule variance dominates outcomes more than talent. Any preview that doesn’t cite SOS variance is missing the structural reality of the current conference. The framework above is the version we apply to any Big Ten conversation. For the broader vocabulary, our sports analytics field guide is the natural companion read.