

Sixty-eight per cent. It appears in the corner of the screen at half time, it leads the match report, and by Monday it has become the reason a manager is being defended or attacked. No other number in football carries that much weight while explaining that little.
The complaint is not that possession share is measured badly. It is measured about as well as anything else in the sport. The complaint is that it answers a question almost nobody is asking. It tells you who had the ball. It does not tell you where, it does not tell you why, and it does not tell you whether having it was a choice or a punishment.
What follows is the case against using it as a proxy for control, the two match types where it points the analysis in exactly the wrong direction, and the two replacements that cost nothing extra to obtain.
Possession, in six lines
- Possession share counts time or passes. Neither includes any information about where on the pitch the ball was.
- Two providers can disagree. Because one measures clock time and another measures pass share, the same match produces two different figures, both correct.
- It is partly a style choice. A side can decide to have less of the ball, and frequently does.
- Field tilt is the cheap replacement. The share of final-third touches between the two teams, which is territory rather than ownership.
- It has its own blind spot. Territory without penetration. Pair it with box entries and the gap closes.
- Two archetypes break possession completely. The deep block that wins, and the side that keeps the ball in front of one.
What possession share actually counts
There are two common methods and they measure different things. The first is time-based: a stopwatch runs while a team is judged to be in control of the ball, and the totals are expressed as percentages of the combined time. The second is event-based: a team’s passes or touches divided by the total for both sides.
Neither has any spatial component. A pass between two centre-backs and a pass into the penalty area contribute identically. Ten seconds of a goalkeeper holding the ball and ten seconds of sustained pressure on the edge of the box are the same ten seconds.
The time-based version has an additional problem: deciding when a team is in possession during a contested phase. Loose balls, deflections, aerial duels and tackles occupy a meaningful share of any match, and where that time is allocated is a definitional choice rather than an observation.
Why two providers give different possession figures
This is the fastest way to demonstrate that the number is a construction rather than a measurement. Look up the same match on two sites and the possession figures will often differ by several points, sometimes more.
The reason is not error. One is counting seconds and the other is counting passes, and the two diverge systematically. A side that plays long, direct football has few passes but can hold the ball for reasonable stretches; a side that plays short, quick combinations racks up passes without necessarily holding it longer. Pass-based possession flatters the second and time-based possession flatters the first.
A number that changes depending on who counted it is not disqualified by that fact, but it does mean any claim built on a difference of four or five points is built on the methodology rather than the match. Reports that lead with a possession figure to the decimal point are quoting a precision the underlying definition does not support.
Why the number correlates weakly with control
Three separate mechanisms push possession share away from anything resembling dominance, and they operate at the same time.
The first is that possession is available. A side can decline it, and many deliberately do, dropping into a compact shape and inviting the opponent to hold the ball in areas where holding it achieves nothing. The share that results is a description of both teams’ intentions, not of one team’s superiority.
The second is game state. A team that concedes early will have more of the ball for the rest of the match almost automatically, because the side in front has an incentive to sit deeper and to slow the game down. Possession accumulated while losing is one of the most reliable patterns in the sport and one of the least informative.
The third is location, which is really the whole argument. The pitch is roughly a hundred metres long and the part of it where possession threatens anything is the last twenty-five. A figure that treats all hundred metres identically has thrown away the only variable that mattered, and that is why the analytical side of the sport moved on from it years before the broadcast graphics did.
Archetype one: the deep block that wins the match
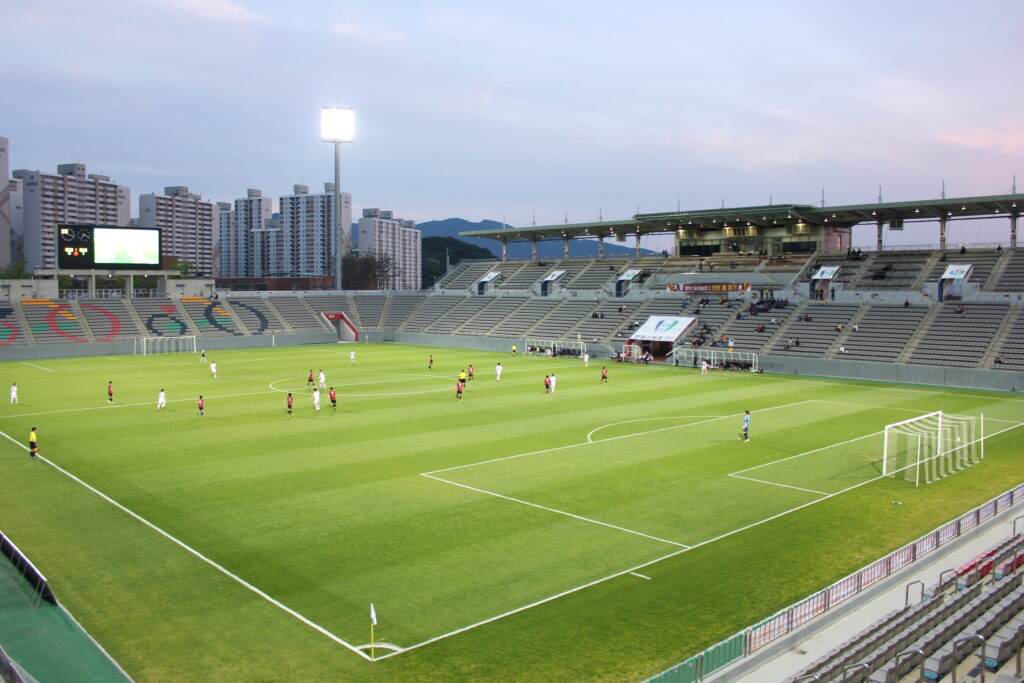
A side sets up in two compact banks, concedes everything in front of them, and defends a box eighteen metres deep. The opponent has the ball for long stretches, passes it from side to side, and finds nothing.
The possession graphic reports something like seventy-thirty. What actually happened is that one team chose a plan, executed it, scored on a break and defended a lead. Describing that as being dominated inverts the match: the side with less of the ball got exactly the game it wanted and the side with more of it was contained.
Field tilt handles this correctly and possession does not. If the opponent’s circulation happened in front of the block rather than inside the final third, field tilt will be far closer to even than possession suggests, and it will show the moments when the block was genuinely pushed back. Those moments are the story, and they are invisible in a possession percentage.
Archetype two: the sterile sixty-five per cent
The second archetype does not involve a deep block at all. A side keeps the ball comfortably, plays a lot of passes, and never enters the final third with any intent. Nobody is pressing them and nobody needs to.
This is the version that produces the most misleading reports, because the visual impression matches the number. The side with the ball looks in charge. They are camped in the opposition half, they are passing accurately, and the graphic confirms it. The absence at the centre of the performance, which is that they never got into the box, does not appear anywhere in the standard set of statistics.
Here field tilt can also be fooled, and this is worth being honest about. A side that pins an opponent in and passes around the edge of the final third will register a high field tilt while creating nothing. What catches it is the pairing: high field tilt with a low count of box entries describes territory without penetration, and that pair of numbers is a diagnosis rather than a description.
What field tilt measures that possession cannot
Field tilt asks where the ball was rather than who had it. That single change fixes most of the problems above without introducing a model, a subscription or a judgment call.
A pass between two centre-backs contributes nothing to it, correctly, because it contributed nothing to the match. A touch on the edge of the opposition penalty area contributes, correctly, because getting there is difficult and everything dangerous happens near there. The metric spends its attention where the sport does.
It also survives contact with contrasting styles. A counter-attacking side that spends twenty minutes without the ball and then arrives in the final third six times in ten minutes will register that as territory, even though its possession share never moves. Comparing two teams with opposite plans is exactly where possession fails hardest and where a territorial measure holds up.
How field tilt is calculated, precisely
The definition is narrower than most casual uses of the term suggest, and the precision matters.
Take every touch one team has inside its own attacking third. Take every touch the other team has inside its attacking third. Field tilt is the first number as a share of the sum of the two. It is a comparison of two attacking thirds, not a comparison of one team’s touches everywhere.
The consequence people get wrong is that defensive actions do not count. A side clearing repeatedly from its own penalty area is touching the ball inside its defensive third, which is not its attacking third, so none of those clearances enter the calculation. That is deliberate: a clearance is evidence that the other side has territory, and counting it would cancel out the very thing being measured.
The other consequence is that field tilt is a share, not a total. A quiet match with few final-third touches on either side and a frantic one with hundreds can produce the same figure. Reading it without the underlying counts is how a fifty-fifty tilt in a match with no attacks gets described as balanced rather than empty.
Field tilt’s own blind spots
Any metric that fixes one problem inherits others, and pretending otherwise is how the next graphic gets over-trusted.
Territory without penetration is the main one, and it is described above. The corner of the final third counts the same as the edge of the six-yard box, so a side that crosses aimlessly or recycles wide can accumulate tilt without threatening.
Game state affects it as much as it affects possession. A team chasing a goal for the last twenty-five minutes will pile up final-third touches, and a tilt figure for a full match will be dominated by that period. Splitting the number by phase, even crudely into thirds of the match, removes most of the distortion and is the single most useful refinement available.
And the denominators get small. In a cautious match between two organised sides, the total number of final-third touches can be low enough that a handful of sequences swings the percentage. When that happens the honest move is to quote the raw counts instead of the share.
Final-third touches, box touches and choosing between them

| Metric | What it counts | The claim it supports | Where it fails |
|---|---|---|---|
| Possession share | Time with the ball, or pass share | A description of style or of a change in style | Any claim about control or superiority |
| Field tilt | Share of attacking-third touches | Which side spent the match in the other’s territory | Territory that never becomes penetration |
| Final-third touch count | Raw totals rather than a share | Whether the match was open or closed at all | Says nothing about the balance between sides |
| Box entries | Occasions the ball reached the penalty area | Genuine penetration, in a number a reader remembers | Noisy over a single match, inflated by crossing |
The working combination is field tilt plus box entries. The first says who had the territory and the second says whether the territory produced anything, and between them they cover almost everything a reader wanted possession to tell them. Neither requires anything more sophisticated than counting, which is why they travel well into coverage of competitions where the deeper data is not public, including most of what gets written before a European knockout tie.
The sentences each number can carry
Possession share can carry a sentence about style. A side that normally holds the ball and did not, or one that surrendered it deliberately for the first time in months, is a real story and the percentage is the fastest way to show it. That is a comparison of a team against itself, which is the only comparison the metric handles well.
Field tilt can carry a sentence about territory. Which half of the pitch the match was played in, when that changed, and what changed it. Adding a substitution or a tactical switch to a tilt figure that moved fifteen points afterwards is close to the most useful paragraph a recap can contain.
Neither can carry a sentence about who deserved to win. That claim needs chances, and chances need shot location or a shot-quality model. Reaching for a territorial number to settle an argument about merit is the same category error as reaching for possession, only one step further along, and the discipline of matching a claim to the number that can actually support it is what separates useful analysis from the confident use of advanced figures in any sport. The governing framework of the game itself, published by the sport’s international bodies and summarised in any reference on the structure of association football, has nothing to say about any of these measures, which is a reminder that they are conventions rather than rules.
Frequently Asked Questions
Is possession completely useless?
No. It is useful for describing intention and for tracking one team over time. What it cannot do is compare two teams in a single match and produce a verdict about which was better, which is the one job it is routinely given.
Where can I find field tilt?
Several public analytics sites publish it, usually alongside expected goals, and some publish the underlying final-third touch counts as well. Where it is not published, the raw counts are sometimes available and the share takes about ten seconds to work out.
Does field tilt work in other sports?
The idea does, though the name does not travel. Any sport with defined attacking territory has some version of it, from zone entries in ice hockey to field position in American football, and all of them are attempts to answer the same question about where the contest was played.
What about possession in the opposition half?
It is a reasonable middle option and better than raw possession. Half the pitch is still a large area, so it is less discriminating than a third and considerably less than a penalty area, but where nothing else is available it is a genuine improvement.
How much can one match tell you at all?
Less than most reports assume. Single-match figures of any kind are small samples, and the useful ones are the least sensitive to a couple of sequences. That argues for quoting counts a reader can hold in their head over percentages calculated to a decimal place.
Next time a graphic says one side had two-thirds of the ball, ask where. If the answer is in front of a defensive block, you have just watched a match the number described backwards.