Ten years ago, the average NBA beat writer carried a notebook, watched the game from the press section, and filed a 600-word piece anchored on a quote from the locker room. In 2026, the same beat writer carries a laptop with three browser tabs open: the official NBA Stats page, Cleaning the Glass, and the team’s internal media portal with proprietary analytics. The notebook is still there. The locker-room quote is still part of the piece. But the surrounding workflow has shifted in ways the casual reader rarely notices.
This is the quiet workflow change that defines modern beat writing. The story still gets reported through traditional means. The supporting data infrastructure has expanded by an order of magnitude. The careful beat writer in 2026 produces analytically grounded coverage almost reflexively, citing efficiency metrics and on/off splits where five years ago she would have cited time of possession or per-game scoring.
The piece below is the working version of what that shift actually looks like. The new workflow stages, the tools the careful writers use, and the short framework that distinguishes analytically literate coverage from analytics-decorated coverage that still relies on the old playbook.
Quick read: the 2026 beat writer workflow in 60 seconds
- Pre-game: Pull season-long efficiency splits, recent on/off data, opponent context.
- In-game: Tape plus live analytics dashboards; usually two screens.
- Post-game: Locker-room quotes paired with rapid analytical breakdown.
- Filing: 800-1,500 words anchored on a specific stat-tape interaction.
- Follow-up: Same beat writer revisits the framing within 48-72 hours if data evolves.
The workflow stages, in detail
Modern beat writing follows a five-stage workflow that did not exist in this form a decade ago. Each stage incorporates analytical inputs that have become routine for serious coverage.
Pre-game preparation. The careful beat writer arrives at the venue with a specific stat-driven storyline in mind. The prep involves pulling the player or team’s recent efficiency splits, identifying matchup-specific metrics (defensive rating vs the opponent’s offensive profile, recent on/off trends), and noting any role-context changes that might shape the night. Pre-game prep that ignores these inputs produces post-game coverage that misses the story.
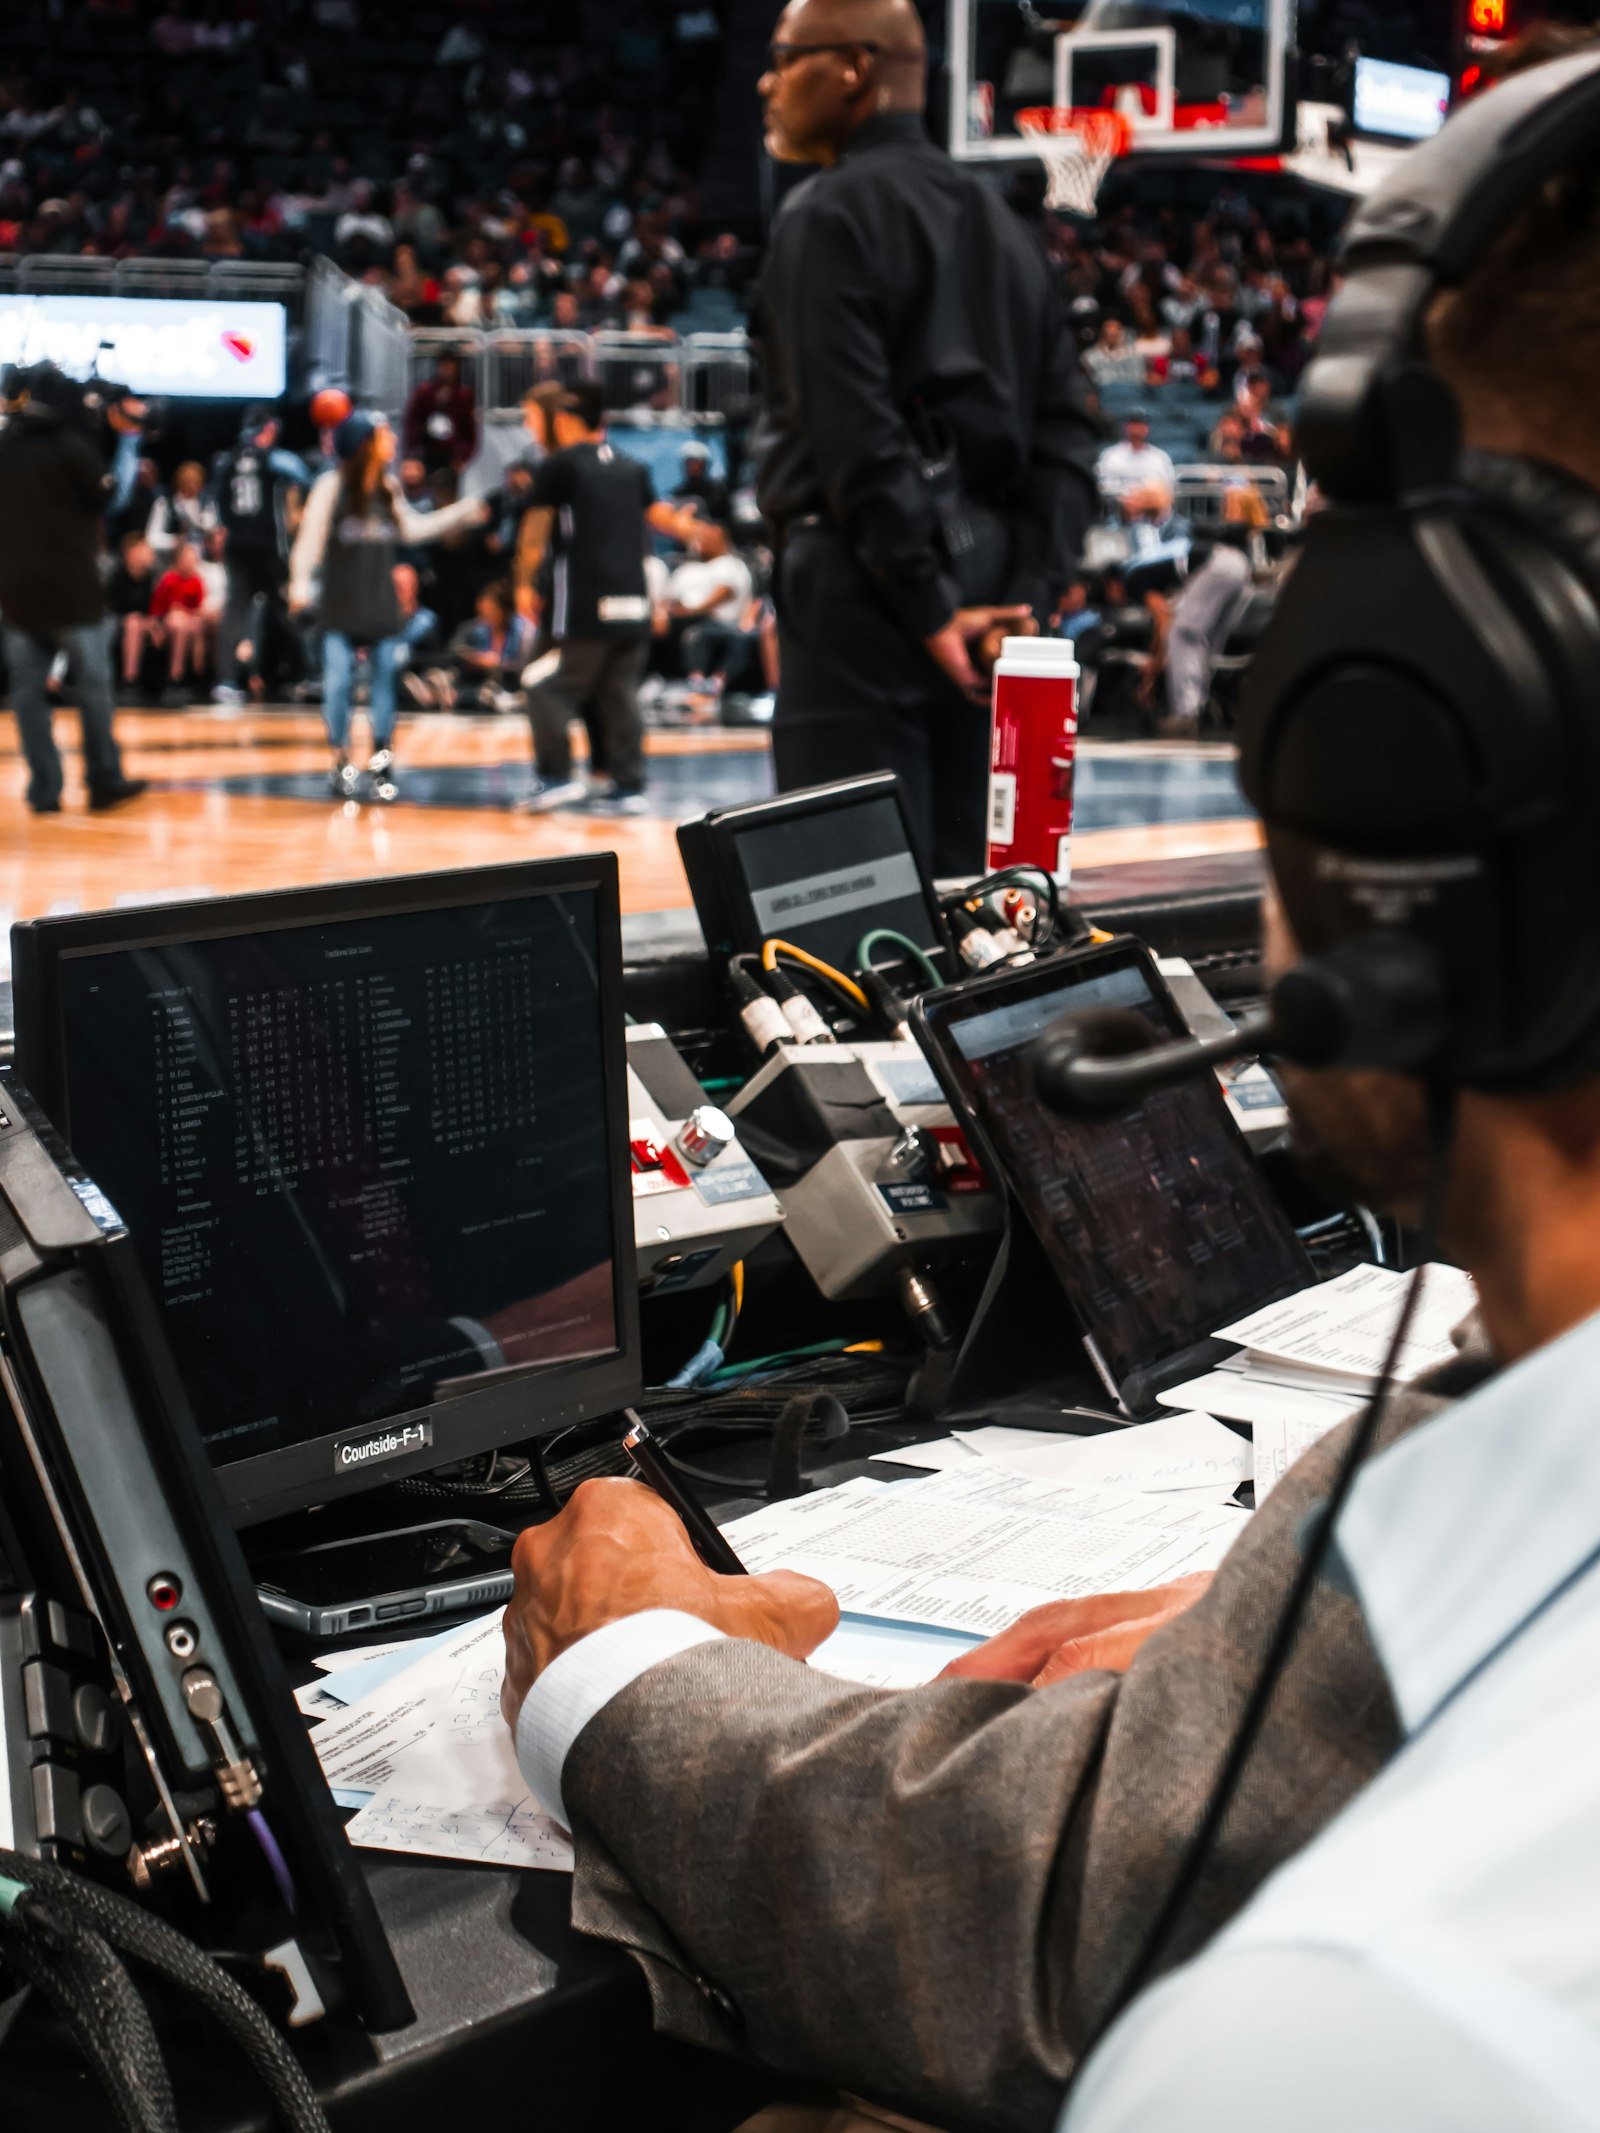
In-game observation. Two screens are now standard for serious beat writers. The first shows the game; the second shows live analytics dashboards (NBA Stats live updates, win probability, real-time efficiency splits). The dashboard does not replace watching the game — the tape still captures the scheme adjustments, body language, and matchup-specific reads — but it complements the observation in ways the pre-2018 workflow could not match. The companion read on balancing both inputs lives in our match-reading workflow piece.
Post-game reporting. The traditional locker-room quote remains the anchor of most beat coverage. What has changed is the writer’s ability to translate the quote into analytical context immediately. A coach who says “we needed to be more physical on the boards” can be evaluated against the actual rebounding numbers within minutes. The quote and the data appear in the same paragraph rather than in separate pieces published days apart.
Filing the piece. Modern beat-writing pieces typically run 800-1,500 words, longer than the 600-word standard of a decade ago. The additional length accommodates the analytical context. Pieces over 1,800 words tend to lose reader attention; under 600 cannot adequately incorporate the new analytical layer. The sweet spot has shifted.
Follow-up coverage. The single biggest workflow change is the expectation that beat writers will revisit their framing within 48-72 hours if the data evolves. A piece written after Tuesday’s game that argued a specific point can be updated, qualified, or contradicted by the same writer after Thursday’s game. The five-stage cycle from Tuesday through Thursday has become a unit of beat coverage, not five separate isolated pieces.
The tools the careful beat writer relies on
The tooling has matured significantly. The table below maps the typical 2026 toolkit against what each tool does.
| Tool category | What it provides | Why beat writers use it |
|---|---|---|
| League-official stats pages | Definitive box-score and advanced data | Authoritative source for filed pieces |
| Public efficiency aggregators (Cleaning the Glass, Basketball Reference) | Garbage-time-filtered splits, lineup data | Surface context that league pages do not |
| Live broadcast dashboards (NBA Stats live, win probability) | Real-time game state updates | Second-screen viewing during the game |
| Proprietary team media portals | Tracking-data summaries, advanced opponent reports | Tier above public data; available to credentialed media |
| Subscription analytics (PFF, Synergy Sports) | Play-type efficiency, scheme tagging | Tactical detail beyond public efficiency metrics |
| Twitter/X analytical community | Real-time analytical reactions | Crowd-sourced framing and counter-framing |
| Newsroom slack/discord with analysts | Internal rapid consultation | Newsroom analytics teams collaborate with beat writers |
None of these tools alone makes a beat writer analytically literate. The combination, used with judgment, is what separates the 2026 workflow from the 2016 version. The framework on which metrics earn their place across multiple seasons lives in our durability piece, and the vocabulary that supports all of this sits in our sports analytics field guide.
Where the analytical workflow has changed the coverage
Several specific dimensions of beat coverage look measurably different in 2026 than they did in 2016.
The “career game” piece is more carefully framed. A player putting up 45 points used to produce a one-day “career night” story. In 2026, the same performance produces a piece that names the true shooting, the usage, the opponent’s defensive context, and the regression considerations. The story is still about the 45 points. The framing has more analytical scaffolding.
The “team is back” piece has standards now. A four-game winning streak produces less coverage now than it used to because beat writers know to wait for sample size to confirm the trend. The schedule context, opponent quality, and underlying efficiency get cited before the “back” framing gets applied. The companion read on why these pieces age badly lives in our schedule tax piece.
Player evaluation routinely cites efficiency-at-usage. A scorer’s volume gets weighted by his shot-quality context as standard practice. The “he’s averaging 22 points” framing now comes with a 56% true shooting tag almost reflexively. This was rare in mainstream NBA coverage as recently as 2018.
Coaching critique includes win-probability data. A coach who punts on fourth-and-three or settles for a long field goal can be evaluated within minutes against the model’s recommendation. The accountability around coaching decisions has tightened because the data is now part of standard broadcast graphics.
A framework for evaluating analytically literate coverage
The table below is the workflow we use to distinguish coverage that genuinely incorporates analytics from coverage that decorates traditional reporting with analytics flavor.
| Question to ask | What it reveals | What it suggests about the writer |
|---|---|---|
| Does the piece name specific advanced metrics? | Whether the analytics are surface or substantive | Specific metrics = real workflow integration |
| Does the piece include sample size context? | Whether the writer understands stabilization | Cited sample = analytical sophistication |
| Does the piece acknowledge opponent context? | Whether the analysis adjusts for who the team played | Opponent-aware = stronger writer signal |
| Does the piece pair stats with tape observations? | Whether the writer balanced both inputs | Stats-and-tape integration = modern beat writing |
| Does the writer update the framing in subsequent pieces? | Whether the coverage is self-correcting | Follow-up updates = serious writer |
| Does the writer name the limits of the metrics cited? | Whether analytical literacy includes caveats | Limits acknowledged = highest signal |
| Does the writer credit the analytical community when applicable? | Whether the ecosystem is being respected | Credit given = healthy media ecosystem participation |
The framework’s job is to identify analytically literate coverage when you read it. The careful writers run through these stages reflexively. The decorative version of analytical coverage skips most of them while citing advanced metrics in headlines.
Where the eye test still beats the dashboard in beat writing
Two specific categories of beat coverage remain harder to capture analytically than the public conversation often admits.
Locker-room dynamics and team chemistry. Beat writers spend hours per week in locker rooms, on team flights, and in press conferences. The qualitative information they collect — coaching staff confidence, player relationship dynamics, internal expectations — does not appear in any analytical dashboard. This is where the beat writer’s eye test still produces information the analyst cannot match. The dashboard has not replaced this part of the workflow; it has supplemented it.
Scheme detail. The specific defensive coverage a team ran on the closing possession, the offensive set the play caller used in a critical moment, the personnel grouping that produced an unexpected result — these tactical details still require watching the tape. The data captures the outcome. The tape captures the choice that produced it. The companion read on balancing both inputs lives in our match-reading workflow piece.
Frequently asked questions
How can I tell if a beat writer is genuinely analytically literate?
Read the writer’s most recent five or six pieces. The analytically literate writer cites specific metrics with appropriate sample-size context, balances data with tape, and updates her framing across consecutive pieces. The decorative version cites metrics in isolation, without context, and rarely revisits earlier framings.
Has the analytical workflow shift affected reader engagement?
Marginally. The analytical-coverage audience is more loyal but smaller. Mainstream sports coverage that pivoted hard toward analytics often saw modest engagement drops; coverage that integrated analytics carefully into traditional reporting frameworks saw the strongest engagement growth. The sweet spot is the integrated version, not the dashboard-first version.
Are different beats (NBA vs NFL vs MLB) at different stages of the workflow shift?
Yes. NBA beat writing is the most analytically integrated, partly because the data infrastructure matured earliest. NFL coverage has caught up rapidly in the EPA era. MLB has always been analytics-forward at the front office level but mainstream beat coverage lags slightly. WNBA coverage is in active maturation. Soccer coverage in major outlets has integrated xG and possession value as standard inputs.
Where can I read examples of the modern beat-writing workflow done well?
The Athletic’s NBA beat writers, The Ringer’s NBA coverage, the better NFL beat writers at major outlets, and the analytical-first writers at Cleaning the Glass all produce pieces that integrate analytics carefully. The Ringer and several Substack-based writers also publish analytical beat coverage at high quality.
The takeaway, in one paragraph
Beat writing in 2026 looks superficially similar to beat writing in 2016 but operates inside a fundamentally different workflow. The pre-game prep, in-game observation, post-game reporting, filing process, and follow-up coverage all incorporate analytical inputs as standard practice. The careful version of this workflow produces coverage that is more accurate, more honest, and more durable than the pre-analytics versions. The framework above is the version we use to distinguish coverage that integrates analytics from coverage that merely decorates with them. For the broader vocabulary this conversation sits inside, our sports analytics field guide is the natural companion read.