
A broadcast overlay draws a shimmering line across the pitch to mark an offside call, a colored zone to suggest pressing intensity, and a speed readout on a sprinting winger, all within the same replay. One of those three genuinely changes what a viewer understands. The other two mostly look like the broadcast has kept up with the times.
Tracking data has made an enormous range of overlays technically possible, and technical possibility has outpaced a harder question that broadcasters rarely ask in public: does this graphic help a viewer understand the play faster, or does it simply demonstrate that the technology exists.
What follows applies one test, understanding speed, to the most common tracking overlays in modern sports broadcasting, and separates the ones that earn their place from the ones that exist mainly to look current.
The one test that matters
- The question. Does the graphic help a viewer understand the play faster than the raw footage alone.
- Passes the test. The offside line, most pressure and pass-network maps used sparingly.
- Fails the test. Most speed readouts, decorative particle effects, constant on-screen data.
- The tell. A graphic that requires its own explanation is failing the test by definition.
- The cost nobody counts. Screen clutter that competes with the actual play for attention.
- Who decides. Production teams, often without direct viewer feedback on comprehension.
The offside line: genuinely useful, still imperfect
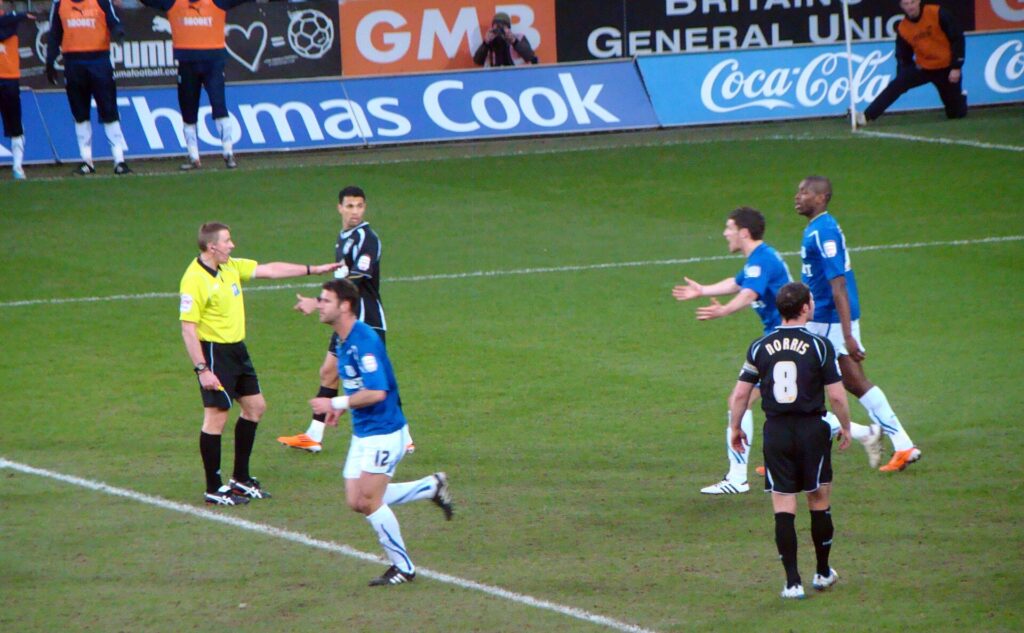
The overlaid offside line remains the clearest example of a tracking graphic that earns its place, because it answers a specific, contested question, was a player ahead of the last defender, in a way that raw footage genuinely struggles to answer at broadcast frame rates and camera angles.
Its value is not that it is perfectly precise, since camera calibration, frame selection and line thickness all introduce a margin of error that the confident visual presentation tends to obscure. Its value is that it converts an argument about a few centimeters into a shared reference point that both sides of a disagreement can look at together, which is a real improvement over the pre-graphic era of frozen frames and guesswork, even accounting for its imperfections.
Pressure indicators: useful when sparse, noise when constant
Graphics that shade areas of the pitch to represent defensive pressure or passing options can genuinely help a viewer see a tactical pattern that would otherwise require years of trained eyes to spot in real time, particularly for showing how a press forces a specific pass rather than another.
The failure mode is frequency rather than concept. A pressure shading graphic shown once, briefly, to illustrate a specific tactical point during a replay adds real understanding. The same graphic left on screen continuously during live play adds visual noise that competes with the actual movement of players for a viewer’s attention, and most viewers cannot process a shifting color field and live action simultaneously without one degrading the other.
Speed and distance readouts: informative in small doses

A numeric speed readout on a sprinting player answers a question, exactly how fast, that raw footage cannot answer at all, which is a genuine piece of information a graphic uniquely provides.
The problem is that the number rarely changes what a viewer concludes about the play. Knowing a winger reached thirty-two kilometers per hour rather than twenty-nine does not meaningfully change the viewer’s understanding of whether he beat his marker; the footage already showed that outcome clearly. The graphic supplies a fact without supplying insight, which is precisely the distinction between a statistic and evidence discussed elsewhere in analysis of how numbers get used in sports coverage. Used occasionally, as color for an exceptional sprint, the readout is a pleasant addition. Used as a constant fixture on every fast player, it becomes wallpaper that most viewers stop reading within a single broadcast.
Four overlays measured against the same standard
| Graphic | What it adds | Verdict |
|---|---|---|
| Offside line | Resolves a specific, contested spatial question | Earns its place, imperfections and all |
| Pressure/pass-option shading | Reveals tactical patterns invisible to the untrained eye | Useful sparingly, noise if constant |
| Speed/distance readouts | Supplies a precise number | Rarely changes comprehension of the play itself |
| Decorative particle and motion effects | Visual flourish around a replay or graphic package | Exists mainly to signal production value |
The pattern across all four is consistent: graphics that answer a specific, otherwise unanswerable question earn their screen time, and graphics that add information without changing a conclusion do not.
Why decorative overlays persist despite failing the test
If a graphic does not improve comprehension, the honest question is why broadcasters keep commissioning them, and the answer has more to do with production competition than with viewer research.
Broadcast packages compete with each other for a reputation of technical sophistication, particularly around marquee events where multiple networks or platforms carry overlapping rights in different territories. A visually dense graphics package signals investment and modernity to viewers and to industry observers alike, independent of whether the individual graphics inside it actually clarify anything. This incentive is structural rather than a failure of any individual production team, and it explains why decorative overlays tend to proliferate fastest around the highest-profile broadcasts, where the pressure to look current is greatest.
The cost of clutter that rarely gets measured
Every graphic added to a live picture competes with the actual play for a viewer’s limited visual attention, and that cost is real even when no single graphic is individually objectionable.
A broadcast layering a live score bug, a possession clock, a pressure map and a speed readout simultaneously is asking a viewer to monitor four data sources while also following a fast-moving game, and something in that stack of demands has to give. Eye-tracking research in adjacent fields, including work referenced by organizations that study broadcast production standards such as the engineering societies that document the medium’s technical evolution, consistently finds that viewers cannot fully process dense on-screen data and live action at once, which means every additional graphic has an attention cost that production teams rarely weigh against its individual informational value.
How the best broadcasts sequence their graphics
The broadcasts that use tracking data most effectively tend to share a sequencing discipline: minimal or no overlay during live play, followed by a dense, explanatory graphic during a replay or a natural break, rather than layering everything onto the live picture continuously.
This sequencing respects the different jobs live play and replay are actually doing. Live coverage needs a clean picture so a viewer can follow fast, continuous action without distraction; a replay is a deliberate pause built for exactly the kind of detailed explanation a dense graphic provides. Broadcasts that blur this distinction, adding replay-level detail to live coverage, tend to produce the clutter that fails the comprehension test most reliably.
The discipline extends to how long a graphic stays on screen once it appears during a replay. A pressure map shown for half a second registers as a flash of color rather than as information a viewer can actually absorb, while the same graphic held for three or four seconds gives a viewer time to connect the shading to the players and passing lanes it is meant to describe. Timing, as much as content, decides whether a well-designed overlay actually does its job.
A simple standard for judging a new graphic
Before adding a new overlay, the useful question is not whether the underlying tracking data exists, since increasingly almost anything can be visualized. The useful question is whether a viewer who has just seen the graphic understands the play meaningfully faster than a viewer who saw only the raw footage.
A graphic that requires its own on-screen explanation to be understood has usually already failed this test, since the explanation is doing the comprehension work the graphic was supposed to do on its own. The graphics that survive this standard tend to be the simplest ones, a line, a highlighted zone, a single clear number, deployed rarely enough that each appearance still carries weight.
Applying the standard consistently also means being willing to retire a graphic once it stops earning its place, which broadcasters are often reluctant to do once a particular overlay has become associated with their coverage. A pressure map that clarified a genuinely new tactical idea when it first appeared can become routine wallpaper within a season or two, and the right response is to use it more sparingly rather than to keep it running simply because audiences have grown used to seeing it there.
How viewers actually describe good broadcast graphics
Ask a casual viewer what they liked about a broadcast’s presentation and the answer almost never names a specific overlay. It names a feeling: the game was easy to follow, or the replay made sense of something confusing. Good broadcast graphics disappear into that feeling rather than announcing themselves.
This is a useful diagnostic in itself. A graphic package that generates its own praise, admired for looking impressive rather than for clarifying anything, is often the same package that a comprehension test would flag as decorative. The best broadcast graphics tend to go unmentioned by viewers entirely, precisely because they did their job quietly enough that nobody felt the need to explain what they had just watched.
Production teams chasing praise for their broadcast graphics specifically, rather than praise for how easy the coverage was to follow, are optimizing for the wrong outcome, and the two goals pull in different directions more often than the industry likes to admit.
What changes as tracking data gets cheaper
The cost of collecting and processing player-tracking data has fallen sharply over the past decade, which means the constraint on broadcast graphics is no longer technical capability. Almost anything trackable can now be visualized in near real time.
That shift raises the stakes on the comprehension test rather than lowering them. When any graphic is technically possible, the only remaining filter on which ones actually appear is editorial judgment about whether a given overlay helps a viewer, and that judgment has not kept pace with the technical capability driving it. The result is a broadcasting landscape genuinely capable of showing anything and not always disciplined about showing only what helps, which is the underlying tension this entire comparison is trying to make visible.
Frequently Asked Questions
Why does the offside line graphic sometimes look wrong even when the call is correct?
Camera calibration, the exact frame selected and the thickness of the drawn line all introduce a small margin of error, which can make a technically correct call look visually close or slightly off, particularly at extreme camera angles.
Do broadcasters test whether viewers actually understand these graphics better?
Rarely in a rigorous, public way. Most graphics decisions are driven by production competition and technical capability rather than by measured viewer comprehension studies.
Are pressure and pass-option maps reliable?
They are reasonable approximations built on tracking data and modeling assumptions, useful for illustrating a tactical concept, but they should not be read as a precise measurement of what a player was actually seeing or considering in the moment.
Why do speed readouts appear more often in some sports than others?
Sports with clear sprint moments, like football and American football, lend themselves to a single dramatic number more naturally than sports with more continuous, varied movement, where a constant speed figure would carry less narrative weight.
Is adding more graphics always a sign of a worse broadcast?
Not necessarily. The issue is not quantity alone but sequencing and purpose. A broadcast that reserves dense graphics for replays and breaks, rather than layering them onto live play, can use a large number of overlays without the clutter cost described above.
The next graphic that appears on screen is worth a single question: does this make the play easier to understand, or does it just look like it should. Most of what earns a permanent place in a broadcast answers the first question honestly, and most of what disappears after a season or two never really answered it at all.