College Football
Returning Production: The Single Most Predictive Variable in College Football
Returning production — what it measures, why it matters so much in college football specifically, where it breaks, and how to use it without...
Independent sports analytics — NFL, NBA, Soccer, College Football, WNBA
Football writer based in Indianapolis. Former college beat reporter who turned to NFL and college football analytics after watching one too many quarterback evaluations built entirely on highlight reels. Skeptical of any take that survives less than three weeks. Covers EPA, DVOA, SP+ and the work that has to happen on the All-22 before any of those numbers make sense.
Returning production — what it measures, why it matters so much in college football specifically, where it breaks, and how to use it without...
Quarterback pressure rate — what it actually measures, how it interacts with the rest of the public analytics toolkit, where it breaks, and why...
Every April, the NFL Draft conversation produces a familiar disagreement. Scouts cite tape and combine measurables. Front offices cite proprietary…
DVOA, where it came from, how it actually worked, where it broke, and why every modern NFL analytical writer still owes the framework a...
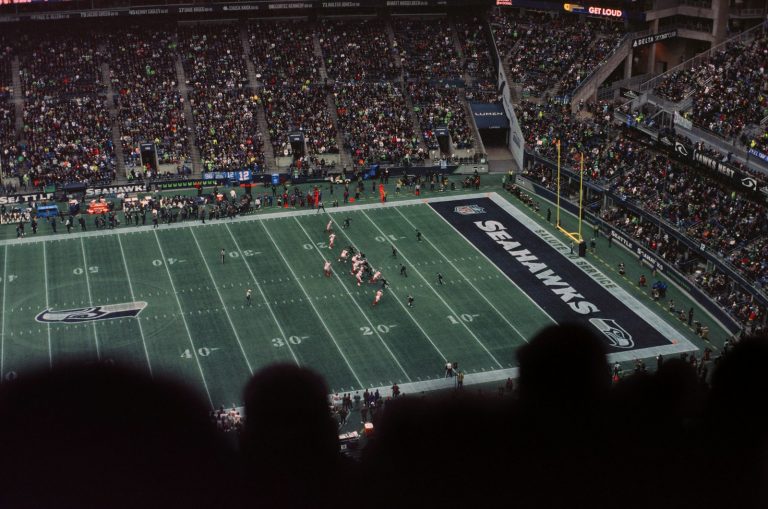
A college football program returns 82% of its offensive production. The preseason ranking moves up four spots. The analytical case…
A team makes the playoffs with the league’s best red-zone touchdown rate. The Monday-morning coverage credits the play calling, the…
The SEC vs Big Ten conference debate, settled (or partially settled) by the numbers, where the data agrees with the consensus and where it...
The Sunday before March Madness produces a familiar ritual. ESPN reveals the bracket. Bracketologists explain what went right and wrong.…
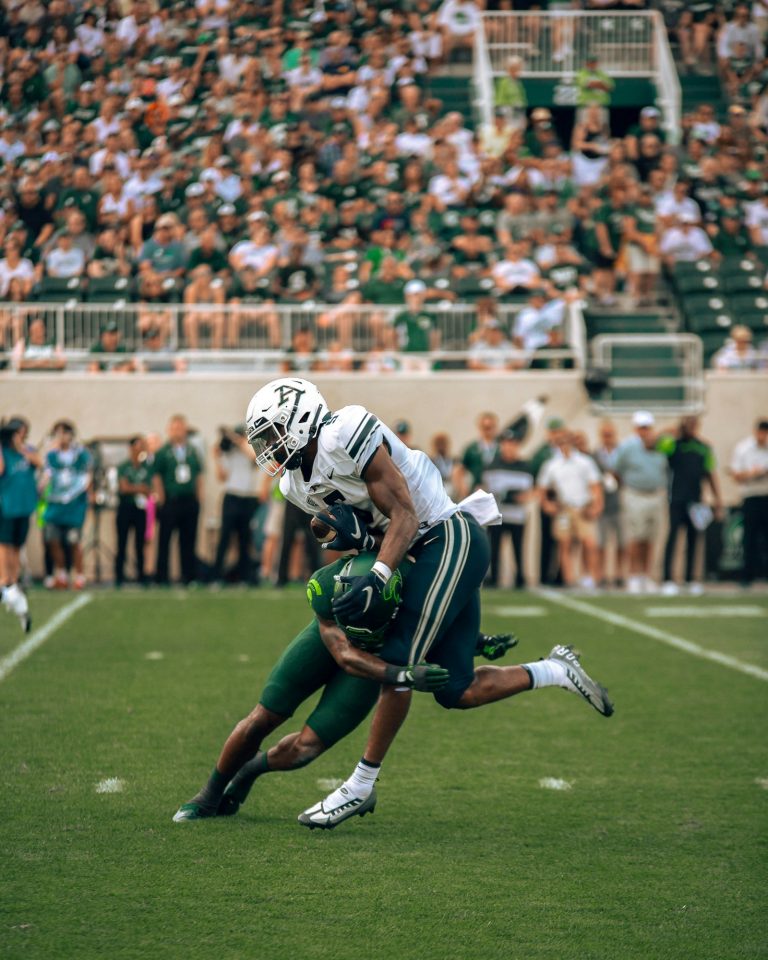
A college football program returns 78% of its offensive production. The major projection models — SP+, ESPN’s FPI, the various…
Watch a Super Bowl from 2002 and the in-broadcast graphics will lead with passing yards, completion percentage, and time of…